Adequate nutrition is a vital foundation for human health, development, and wellbeing across the entire lifespan. Proper intake of protein, vitamins, minerals and other dietary components fuels growth, fights infection, powers cognition, supports pregnancy, and delays aging-related disease. However, nutrient needs differ substantially based on age, gender, lifestyle and health status.

To guide individuals and groups in meeting nutritional demands, health authorities have established Dietary Reference Intakes (DRIs). DRIs represent comprehensive evidence-based recommendations concerning amounts of nutrients healthy people require daily. This includes setting estimated average requirements, recommended daily allowances, adequate intakes and tolerable upper limits.
DRIs provide finer age- and gender-specific detail than the Daily Values (DVs) displayed on Nutrition Facts panels. They also differentiate needs during pregnancy and lactation. Further, DRIs outline average, elevated and toxic intake thresholds only for nutrients with sufficient data. This is coupled with methodologies for systematically assessing diet adequacy.
However, nutrition science continues advancing rapidly. This article outlines:
- Key types and uses of DRIs
- How DRIs are adapted across lifespans and groups
- Relating DRIs to DVs on food labels
- DRI applications globally
- Approaches for evaluating intakes against DRIs
- Future directions fortifying DRIs’ relevance through research integrating personalized nutrition, nutrigenomics, and global harmonization.
Refining DRIs is essential for improving dietary counseling and interventions while combating population risks of malnutrition. Both excesses and deficiencies in nutrient intakes raise risks for numerous adverse outcomes – from stunted infant growth to increased cancer or cardiovascular mortality among adults. Reliable, evidence-based DRIs are the bedrock enabling nutrition experts to optimize health at every life stage.

Purpose and Importance of Dietary Reference Intakes
The main objectives of the DRIs are:
- Set intake levels of essential nutrients associated with reduced risk of chronic disease
- Provide quantitative guidelines to assess the adequacy of nutrient intakes
- Establish Tolerable Upper Intake Levels (ULs) above which risk of adverse effects may increase
- Inform nutrition policies and food fortification/enrichment practices
Key Components and Categories of DRIs
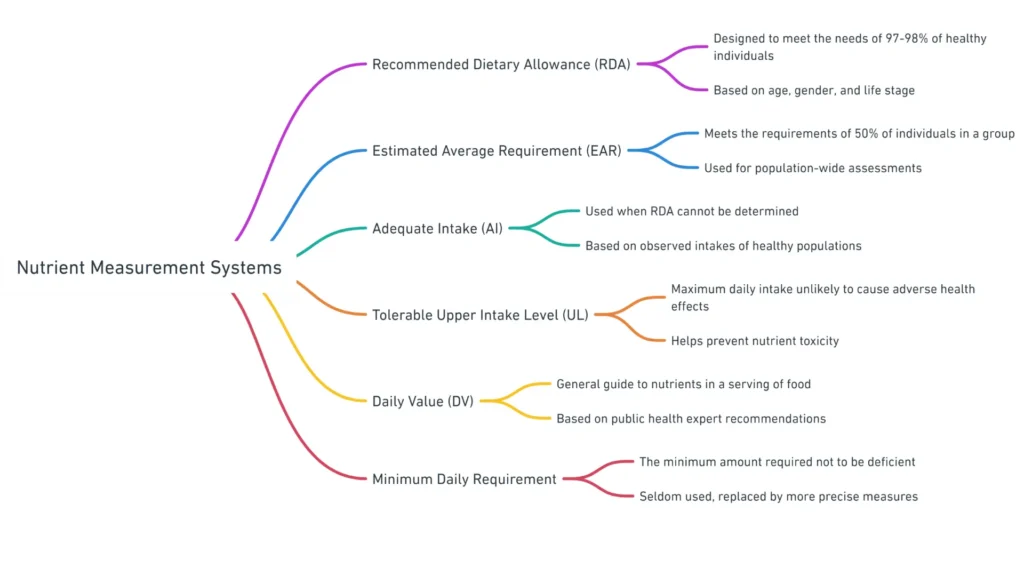
The DRIs collectively refer to four primary types of reference values:
- Recommended Dietary Allowance (RDA)
- Estimated Average Requirement (EAR)
- Adequate Intake (AI)
- Tolerable Upper Intake Level (UL)
Each of these has distinct definitions, derivation methods, and applications, which will be covered in detail throughout this article.
DRIs Across Age Groups and Life Stages
Nutrient needs change over the course of life depending on growth, pregnancy, lactation, and aging. The DRIs have taken these alterations into account by providing intake recommendations for specific life stage groups.
Infancy and Childhood
During infancy, childhood, and adolescence, nutrient requirements are elevated to support the rapid pace of growth and development. Bone elongation, increases in muscle and organ mass, immune system maturation, and brain development place high demands for nutrients like protein, vitamins, minerals, essential fatty acids.
Infant Nutrient Needs
In the first 6 months of life, infant nutritional needs are met by breast milk or infant formula. DRIs during this time are therefore set for certain nutrients based on their concentrations in human milk from healthy well-nourished mothers. These include recommended intakes for vitamins A, C, and B6 as well as minerals like calcium, phosphorus, magnesium, and iron set at levels consistent with amounts transferred via breastfeeding.
From 6-12 months, infants transition to solid foods in addition to breast milk or formula. The increased dietary diversity provides a wider range of nutrients, so additional DRIs are established for this age group covering intake recommendations for zinc, copper, selenium – nutrients not easily measured in breastmilk.

Children’s Nutrient Requirements
Between the ages of 1-13 years, the DRIs expand further to include essentially all essential vitamins and minerals. Requirements during childhood are still substantially above those of adults on a per kilogram body weight basis due to rapid lean tissue accretion, bone mineralization, and energetic needs for activity.
For example, the RDA for protein is 1.2 grams/kg/day for toddlers compared to just 0.8 grams/kg/day for adults. Intake levels of bone-related micronutrients like calcium and phosphorus are more than doubled in childhood versus maturity. These elevated needs persist throughout adolescence as well.
Adolescent Nutrition
During the adolescent growth spurt, nutrient requirements peak – even exceeding those in pregnancy and lactation. Teenagers need to take in enough protein, vitamins, and minerals both to complete their own growth and maturation processes, as well as store nutrients in preparation for future reproductive demands.
Consequently, RDA or AI levels for vitamins A, C, B6 and B12, calcium, zinc, and magnesium are all highest for adolescents relative to any other life stage group. Supporting these maxed out dietary recommendations is essential to growing healthy teens and avoiding nutritional deficiencies.

Adult and Elderly DRIs
Upon reaching maturity in early adulthood, growth ceases and baseline nutrient demands decrease for most adults. However additional needs arise for women during pregnancy and lactation, while requirements may rise again for both men and women in older age.
Early Adulthood Nutrition
For most healthy men and women between ages 19-30 years, the DRIs align with nutrient intakes shown in research to support optimal health and function. Examples include RDA levels for iron, folate, zinc, and vitamin A, as well as AI guidelines for vitamins K, E, and choline.
These adult recommendations form the basis for the Daily Values (DVs) displayed on food labels, which provide benchmarks for comparing foods and meeting daily needs. The percentage DV shows how a food’s nutrient content contributes to overall intake guidance.
Pregnancy and Lactation Nutrient Demands
During pregnancy and breastfeeding, women have expanded needs to support fetal/infant development. Nutrients are transferred directly to the growing baby in utero or via breast milk. Maternal stores are also tapped to supply high demands.
As a result, intake requirements rise substantially for vitamins A, B6, B12, C, and D as well as minerals like iron, iodine, zinc, selenium to compensate for losses. For example, the RDA for folate doubles from 400 μg/day pre-pregnancy to 600 μg/day in pregnancy to promote healthy fetal organ maturation. Lactating women also require taking in more energy, protein, calcium, and magnesium to support breast milk production.
Nutrition of Older Populations
Advancing age brings evolving nutrient needs with changes in physiology, body composition, and metabolism. Requirements for some nutrients increase in older adulthood, while for others they decline or remain unchanged.
For instance, recommended calcium intakes escalate to maintain bone strength and prevent heightened fracture risk with aging. In contrast, energy requirements gradually fall due to drops in resting metabolic rate and physical activity. Intakes of magnesium, zinc, vitamin K may also need boosting based on age-related absorption changes or deficiencies.
Concurrently, recommendations for other nutrients like vitamin B12 or selenium remain stable despite the aging process, if no chronic conditions are present impacting utilization. Overall, tailored guidance taking physiological shifts into account is warranted in this group.

Factors That Influence Nutrient Requirements
Beyond broad age-based differences, an individual’s genetics, health status, and lifestyle can all uniquely alter dietary requirements – even within the same life stage group.
Health Conditions Affecting Needs
Certain medical conditions increase utilization or excretion of nutrients, raising needs. For example, rapid cell turnover in cancer drives up demands for protein, iron, and antioxidants. Medications like metformin and PPIs also impact vitamin B12 absorption. In these cases, condition-specific intake advice that exceeds standard recommendations is justified.
Genetics Variations in Needs
Gene variations can impact nutrient metabolism, changing individual requirements. Having a MTHFR gene mutation reduces activation of folate, increasing the RDA to meet needs. Specific low-fat diet advice may be indicated for those with familial hypercholesterolemia risk genes. Overall, genetic predispositions should be considered in tailored guidance.
Lifestyle Impacts on Requirements
Habits like smoking, alcohol consumption, restrictive dieting or intense training regimes can all increase micronutrient needs. For instance, higher protein, iron, calcium, and antioxidant intake is warranted for athletes. Likewise, those following vegan diets require reliable vitamin B12 sources since it is absent from plants. Thus lifestyle factors warrant attention when assessing and advising on nutritional adequacy.
In summary, DRIs serve as scientifically validated benchmarks for intake, but individual adjustments taking into account life stage, health aspects, and habits are still essential for optimal, personalized nutrition guidance.
Defining the Major Types of DRIs
Within the DRIs, there are four central reference values – the RDA, EAR, AI, and UL. Each has distinct definitions, methods for determining the intake levels, and applications.
RDA and EAR – Description and Uses
The RDA (Recommended Dietary Allowance) and EAR (Estimated Average Requirement) both refer to the average daily dietary intake level of a nutrient considered sufficient to meet the needs of nearly all healthy individuals in a specified gender and life stage group. However, they are derived using different approaches.
Clear Definitions
The RDA is the average daily intake level of a nutrient that satisfies the requirement of 97-98% of healthy persons in a life stage and gender group. It is set to meet needs of almost all individuals in the category, assuming a normal distribution of requirements.
In contrast, the EAR is the average intake value estimated to meet the nutrient requirement of 50% of healthy individuals in that group, assuming a normal requirement distribution. The EAR reflects the estimated point of intake adequacy for half the population.
Deriving and Applying RDAs and EARs
The EAR is derived first based on a review of research on nutrient needs in relation to health indicators or body stores. The RDA is then calculated using a statistical formula to determine the intake level covering requirements of nearly all persons, assuming needs follow a normal curve.
Specifically: RDA = EAR + 2 SDEAR, where SDEAR is the standard deviation of the EAR. This yields an intake level exceeding the needs of 97-98% of individuals.
The EAR is used to assess the prevalence of nutrient inadequacy in groups and aid planning for meeting needs. The RDA serves as a goal for intake by individuals and evaluating adequacy.
Distinguishing Between RDAs and EARs
In summary, the EAR meets the needs of half the population; the RDA covers almost all healthy persons. The EAR guides assessment of overall diet adequacy for groups; the RDA provides intake advice for individuals.
For example, the EAR for calcium is 800 mg/day for adults. Based on variability in requirements, the RDA was set at 1000 mg/day, providing a level estimated to meet calcium needs of 97.5% of the population rather than just 50% covered by the EAR threshold.
AI and UL – Insights and Appropriateness
In addition to establishing average intake recommendations, the DRIs include values for Adequate Intake (AI) and Tolerable Upper Intake Level (UL) to guide intake ranges for sufficiency and safety.
Defining AIs and ULs
An Adequate Intake (AI) is specified where evidence is insufficient to set an EAR/RDA. The AI reflects the average intake level observed in healthy groups with no apparent deficiencies. This indicates assumed adequacy but with uncertainty due to limited data.
The Tolerable Upper Intake Level (UL) indicates the maximum daily intake unlikely to result in adverse health effects. Intakes above the UL may increase risk of toxicity or other unintended impacts over time in healthy populations. This provides guidance on excessive supplemental doses.
When AIs and ULs Should Be Used
AIs provide tentative benchmark intakes in the absence of dose-response data needed for EAR/RDA derivation. These are based on observed mean intakes by healthy groups with no deficiencies. AIs can inform individual guidance but lack the ability to rigorously assess prevalence of inadequacy in groups.
In contrast, ULs indicate thresholds for potential toxicity. These help limit excessive intakes from supplements that could raise risk for adverse effects. ULs are not meant to guide recommended intake levels, which are far below amounts associated with harm.
For example, the AI for vitamin K is 120 μg/day for men and 90 μg/day for women based on typical intakes correlating with adequate blood coagulation function. In contrast, the UL for vitamin K is set at 1000 μg/day due to possible impacts on anticoagulant medications at very high doses.
Relating DRIs to Food Labels
In addition to guiding nutrition policies and programs, DRIs provide the scientific basis for Daily Values (DVs) displayed on food labels that allow assessment of a food’s contribution to meeting daily needs.
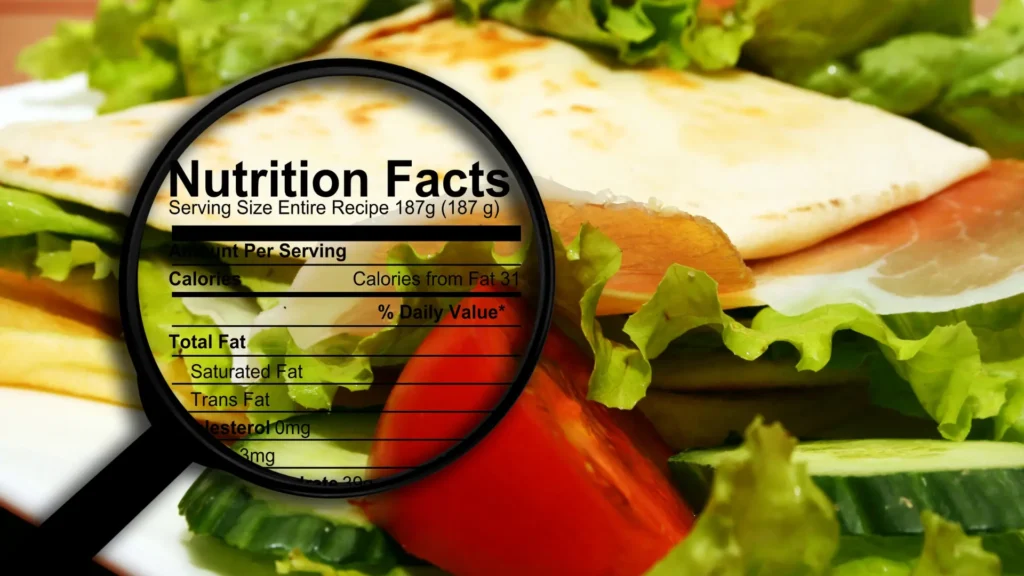
Daily Values vs. DRIs
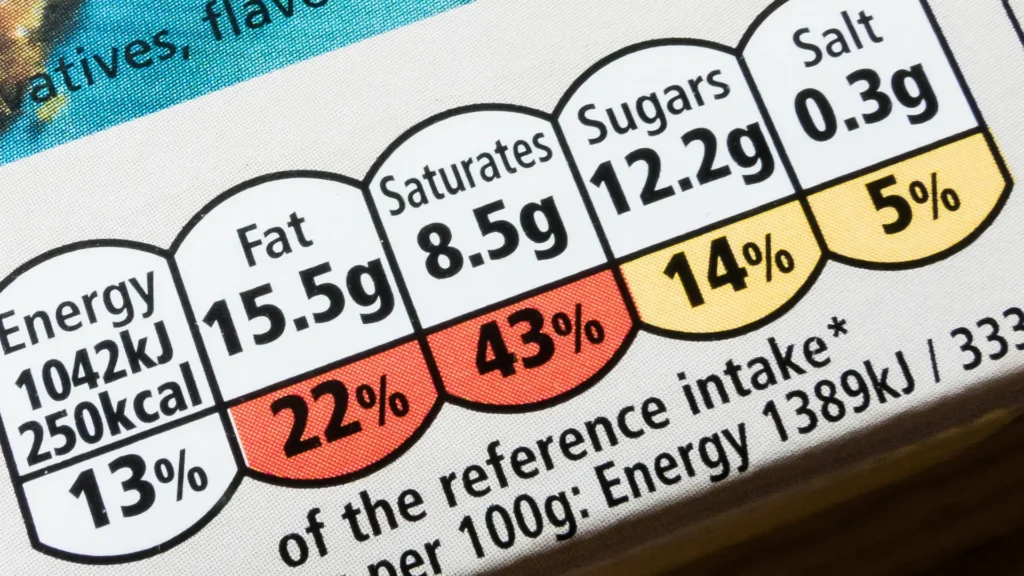
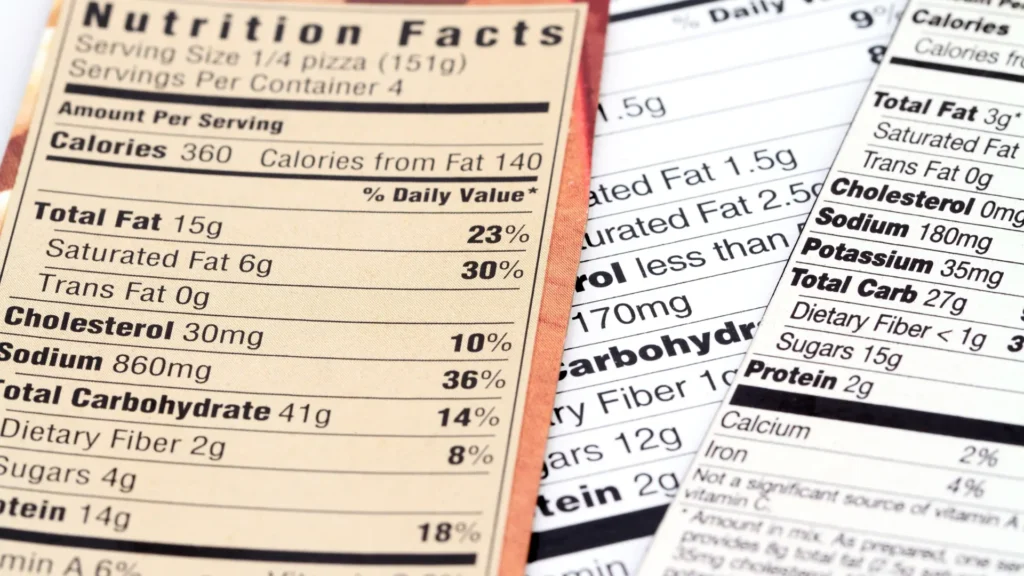
Daily Values (DVs) are standard daily reference intake levels for nutrients. They provide benchmarks for evaluating the percentage of the recommended amount supplied by a food serving.
DVs were established based on the highest recommended intakes or adequate intake levels for vitamins and minerals across gender groups. For macronutrients, DV levels reflect distribution ranges linked to reducing risk of chronic disease at standard calorie intake levels (2000 or 2500 calories/day).
For example, the Daily Value for protein was set at 50 grams per day, which aligns with 10% of calories coming from protein in a 2000 calorie diet. This falls within expert-recommended intake ranges for protein.
Similarly, the 1300 mg Daily Value for calcium corresponds to the Recommended Dietary Allowance for calcium for teenagers and adult women who are pregnant or breastfeeding – representing the highest intake level needed for adequate nutrition.
In summary, DVs provide a simplified standard for evaluating if a serving of food is providing a little or a lot of a nutrient in relation to daily requirements for health and chronic disease risk reduction. Food manufacturers use DVs for food labels.
| Food labeling has progressed over centuries from simple identifiers of product origin to detailed nutrition information aimed at empowering consumer choice and shaping industry practices. Early bread and wine labels in 13th century Europe were basic marks indicating a manufacturer to prevent fraud. More formal food labeling regulations emerged in the early 20th century in the US and Europe, prohibiting adulteration and requiring quantity disclosures on packages. However, it wasn’t until the 1990’s Nutrition Labeling and Education Act in the US and European Union Directive 90/496 that standardized Nutrition Facts labels became mandatory for most foods, listing calories, fats, nutrients, and percent daily values. This prominent, understandable format providing extensive nutritional data marked a seminal shift on both sides of the Atlantic to enabling informed dietary decisions. Additional label updates continue aligning recommendations with advancing public health research on appropriate nutrient intakes. |
Comparing DVs to DRIs – Commonalities and Differences
While DVs draw heavily on DRIs to indicate maximum recommended intakes by life stage, distinctions exist since DVs are based on standard serving sizes and calorie levels rather than tailored age/gender nutrient needs.
Similarities between DVs and DRIs
The Daily Values (DVs) set for vitamins and minerals utilize the highest Recommended Nutrient Intakes (RNIs) or Recommended Daily Allowances (RDAs) that have been established. They choose the maximum levels to ensure the DVs adequately cover 97-98% of healthy individuals over 4 years old.
There are a couple exceptions. Iron and calcium requirements show much more variability between individuals, so their DVs don’t align with the highest recommendations.
For macronutrients like carbohydrates, protein and fats, the DVs fall within ranges that experts say are associated with lower risk of chronic diseases. These ranges are called the Acceptable Macronutrient Distribution Ranges (AMDRs). They reflect optimal percentage intakes from daily calories for reducing disease risk.
For instance, the DV for protein represents about 10% of calories from a 2000 calorie diet. That aligns with expert guidance that 10-35% of calories from protein is optimal for health.
In summary, the micronutrient DVs aim to sufficiently meet the needs of almost all healthy people over 4, while macronutrient DVs represent intake ranges tied to potential health benefits.
How DVs and DRIs Differ
Daily Values (DVs) take a one-size-fits-all approach – they provide a single recommended daily amount for each nutrient for all healthy people over 4 years old. But Dietary Reference Intakes (DRIs) give different recommended intakes for different groups like babies, kids, adults, pregnant women, and seniors.
However, the DV levels are set to meet the needs of whichever age and gender group has the highest recommendations. For example, the DV for calcium covers what pregnant women need, since they require more than men or elderly people.
Another difference is that DVs base their recommended amounts on people eating standard 2000 or 2500 daily calories. But DRIs give estimated required intakes even for people like athletes who eat more calories per day, or older adults who eat less.
Additionally, DRIs include some guidance around nutrients that DVs don’t provide equivalents for. For example, DRIs have Estimated Average Requirements (EARs) to assess whether nutrient intakes are adequate on average for groups of people. And they include Tolerable Upper Limits (ULs) to set maximum safe intake thresholds – but DVs don’t address assessing average group intakes or upper limits.
Therefore, while DVs set single recommendation levels designed to sufficiently meet all healthy people’s needs, DRIs provide more personalized and detailed guidance optimized for different groups and purposes.
Selected Nutrient DV and DRI Levels
For certain vitamins/minerals, DVs align directly with highest life stage RDAs/RNIs. For example, the DV for Vitamin B12 at 2.4μg matches the RDA for adults over 50 years. Similarly, the DV for phosphorus at 1250 mg equals the RDA for 14-18 year olds.
However, for iron and calcium, DVs are set lower than max RDAs/RNIs due to wide variability in requirements. The iron DV is just 18 mg versus 27 mg RDA for pregnant women. The calcium DV is 1300 mg versus 1300-1400 mg RDAs for adolescents or lactating women.
In summary, while the DVs utilized for food labels differ from tailored life stage DRIs, they are derived based on RNIs/RDAs and provide intake benchmarks for the general healthy population.
Global Perspectives on Dietary Reference Intakes
While the DRIs provide intake recommendations for the United States and Canada, other countries and regions utilize alternative systems for establishing nutrient intake values, albeit with some commonalities in scientific approaches.
DRIs in the United States and Canada
The DRIs were jointly developed for the United States and Canada by the Food and Nutrition Board of the Institute of Medicine (IOM), part of the National Academy of Sciences. These intake recommendations are utilized by both countries for nutrition policies, food fortification/enrichment regulations, nutrition program guidance, and research applications.
The DRIs also inform the Daily Values for food labels in the U.S. and the Nutrient Value of Some Common Foods reference issued by Health Canada. So the DRIs serve as core dietary reference standards for both countries.
European DRI Concepts
European countries utilize nutrient recommendations developed specifically for harmonization across the region. However, the derivation process and concepts align with those underlying the DRIs.
Nutrient Reference Values in Europe
Europe’s nutrient intake benchmarks include the Population Reference Intake (PRI) along with Nutrient Reference Values (NRVs) for labeling purposes.
The PRI indicates levels of nutrient intake that are adequate for nearly all persons (97.5%), similar to the EAR/RDA. PRIs cover age/gender groups. The Average Requirement (AR), comparable to the EAR, is the intake adequate for 50% of people.
Nutrient Reference Values (NRVs) represent the labeling Daily Values, like the U.S. DVs. These indicate recommended maximum daily intakes adequate for most healthy people, analogous to high life stage RDAs/RNIs.
So while the terminology differs, the PRI and NRV concepts align with DRIs/DVs. Values are set based on similar data review processes weighing strength of evidence on dose-response relationships.
United Kingdom’s Nutrient Recommendations
The United Kingdom utilizes Reference Nutrient Intakes (RNIs) as their index intake standard. These are comparable to U.S. RDAs, indicating levels meeting requirements of 97.5% of a group by age and gender.
EARs are also set as lower threshold intakes covering half the population. So the UK system mirrors the RDA/EAR framework, utilizing the same statistical extrapolation from the EAR to derive the RNI intake goal. Terminology is the main distinction.
For labeling, the UK also defines Nutrient Reference Values (NRVs) as benchmarks for comparisons, similar to European and U.S. Daily Values.
Ukraine’s Guidelines
Ukraine relies on its own system of reference intake values and diet adequacy measurements, though aligned with international standards on key concepts. The country’s nutrient recommendations are defined as Physiological Norms (Норми фізіологічних потреб), which are set by Ukraine’s Ministry of Health and the Institute of Gerontology. These play a similar role to the Dietary Reference Intakes (DRIs) utilized in the United States and Canada.
The Physiological Norms specify age- and gender-specific Recommended Daily Intakes (Рекомендована добова норма споживання) for essential nutrients considered adequate to meet requirements of nearly all healthy individuals based on metabolic evidence. These reference values are used for planning and assessing diets, analogous to the EARs and RDAs of the DRIs.
For food labeling purposes, Ukraine defines Reference Daily Intakes (Рекомендоване денне споживання) of key nutrients considered sufficient for most persons, comparable to the Daily Values (DVs) on U.S. nutrition labels. Food manufacturers utilize these benchmarks to determine the percentage contribution per serving towards the reference intakes.
To evaluate overall diet quality against the Physiological Norms at the population level, Ukraine applies Nutrient Adequacy Ratios (співвідношення адекватності поживних речовин) and Mean Adequacy Ratios (середнє співвідношення адекватності). These methodologies are consistent with international approaches for assessing nutritional adequacy and identifying potential deficiencies based on reported intakes from national surveys.
So in summary, Ukraine relies primarily on its own nutrient recommendation system aligned with global standards, while utilizing similar terminology and diet quality evaluation methodologies as other countries to facilitate nutritional status assessment and inform nutrition policies.
Kazakhstan’s Intake Values
Kazakhstan relies primarily on its own national Sanitary Rules and Norms (Санитарные правила и нормы, СанПиН) to establish recommended daily intake levels of nutrients for various population groups. These serve a similar function as the Dietary Reference Intakes (DRIs) used in the United States and Canada or the Population Reference Intakes (PRI) in Europe.
Specifically, Kazakhstan’s SanPiN values provide quantitative intake recommendations for energy, macronutrients, vitamins and minerals that are considered adequate to meet the needs of 97-98% of healthy individuals by age and gender. For example, potassium intake levels are specified for children, men, women, pregnant women and seniors.
For food labeling purposes, Kazakhstan uses the Uniform Values of Food and Energy Value (Единые значения пищевой ценности) adopted across the Eurasian Economic Union (EAEU). These are conceptually comparable to the Reference Daily Intakes (RDI) used in Codex standards or the Daily Values (DVs) on U.S. food labels. However, the specific derivation methodology and values may differ.
To assess diet quality and adequacy, common approaches include calculating the Diet Variety Score (коэффициент разнообразия рациона, КРР) and Index of Nutritional Adequacy (индекс адекватности питания, ИАП). These seem analogous to the Mean Adequacy Ratio (MAR) used in the U.S. and Europe. Consumption frequency of key food groups is also evaluated against recommendations.
So while Kazakhstan relies on its own national standards embodied in the SanPiNs to set dietary recommendations, it utilizes some harmonized EAEU mechanisms for food labeling and diet assessment that enable regional comparisons. But terminology and quantitative intake levels still vary from U.S. and European benchmarks.
Working Towards Global Harmonization
To facilitate harmonization of intake guidance globally, WHO/FAO provide recommended nutrient intakes (RNIs) covering minimum levels to prevent deficiencies in all age/gender groups.
These are periodically updated based on expert consultations weighing strength of evidence on requirements. The WHO/FAO RNIs serve to guide countries in developing regional intake recommendations tailored to local nutrition issues and food patterns.
So in summary, while reference intake terminology differs, common scientific procedures are utilized globally to systematically determine benchmark dietary recommendations for nutrition adequacy.
Table: Defining Key Terminology
| Term | Definition | Application |
| RDA | Recommended Daily Allowance; average daily intake level that meets needs of 97-98% of healthy individuals in a demographic group | Reference intake level for individuals to aim for |
| DV | Daily Value; intake level considered nutritionally adequate for most healthy individuals 4+ years old | Used to determine %DV for food labels |
| NRV | Nutrient Reference Value; intake level adequate for average healthy EU adult | EU standard for food labeling |
| EAR | Estimated Average Requirement; intake level estimated to meet needs of 50% of healthy individuals in a group | Used to assess nutrient inadequacy prevalence |
| LRNI | Lower Reference Nutrient Intake; intake level adequate for only 2.5% of population | Indicates intake is likely inadequate |
| PRI | Population Reference Intake; intake meeting needs of 97.5% of EU population | EU equivalent to the RDA |
| RNI | Reference Nutrient Intake; intake meeting needs of 97.5% of UK population | UK equivalent to the RDA |
| NAR | Nutrient Adequacy Ratio; ratio of intake to recommendation for a nutrient | Assesses intake adequacy for nutrients |
| MAR | Mean Adequacy Ratio; average of NARs for multiple nutrients | Overall diet adequacy assessment |
| AMDR | Acceptable Macronutrient Distribution Range; recommended range of intakes for protein, carbs, fat | Expressed as percentage of total calories |
| UL | Tolerable Upper Intake Level; maximum intake unlikely to pose risk | Indicates intake excess |

Evaluating Intakes Against DRIs
DRIs provide quantitative guidance on intake adequacy, but actual dietary assessments are needed to evaluate if individuals or groups are meeting recommendations as well as identify potential nutritional deficiencies.
Dietary Assessment Methods
Various validated tools are utilized to measure habitual food intakes with reasonable accuracy, including 24-hour recalls, food records, and food frequency questionnaires.
24-Hour Recalls
24-hour recalls measure all foods and beverages consumed over the prior 24 hours via an interview by a trained nutrition professional. Multiple non-consecutive days of recalls capture day-to-day variability. Recalls can be automated for self-administration online.
Food models, portion size estimation aids, and probing questions improve accuracy. Recalls can provide reasonable estimates of mean group intakes for comparison to DRIs but may not reflect individual usual intakes due to within-person variation.
Food Diaries and Records
Food records capture detailed information on all items consumed over 3 or more days, including amounts measured via scales or household measures. Participants self-report their intakes in real-time, limiting recall bias. However, the burden of meticulously recording diets can influence food choices and eating patterns.
Food records can better represent individual habitual intake versus recalls if kept over sufficient days. But many find comprehensive recording over long periods challenging. Capturing weekdays and weekend days is ideal to reflect variability.
Food Frequency Questionnaires (FFQs)
FFQs provide a list of commonly consumed foods for participants to report their usual frequency of intake over weeks or months. Portion size questions or standard serving assumptions allow estimation of amounts. Cost-effective for large samples, FFQs assess typical intake patterns.
However, FFQs rely considerably on memory and awareness of diets. Closed food lists also limit complete capture of all items eaten. FFQs can effectively rank individuals by high/low food group intakes but don’t precisely quantify total consumption.
In summary, each assessment method has strengths and limitations. Using multiple approaches can provide a more complete picture of intake for comparison to DRIs.
Determining Nutrient Adequacy
Individual intakes measured via 24-hour recalls or food records can be compared directly to DRIs like the RDA or AI to ascertain if amounts consumed seem likely to meet needs. However, these methods capture only a snapshot, so evaluating adequacy across groups over time requires additional techniques.
Two methods frequently used are the Nutrient Adequacy Ratio (NAR) and Mean Adequacy Ratio (MAR).
Nutrient Adequacy Ratios (NARs)
A NAR score is calculated for each nutrient as the ratio of a person’s intake to the relevant DRI (EAR or AI):
NAR = Individual’s intake ÷ DRI (EAR or AI)
NARs below 1.0 indicate a higher likelihood of inadequacy for that nutrient. NARs are capped at 1.0 even if intakes exceed recommendations to avoid distorting overall diet quality assessment. Analyzing NARs for key nutrients evaluates which may require attention.
Mean Adequacy Ratio (MAR)
The MAR provides an overall indicator of the nutrient adequacy of dietary intakes for an individual or group by averaging the NARs for selected nutrients.
MAR = Sum of NARs ÷ Number of nutrients
The maximum MAR score is 1.0. MAR values of 0.6 or lower may signify higher risk for deficiency, while higher MARs indicate lower likelihood of inadequacy across multiple nutrients. Comparing sub-groups can identify nutritional vulnerabilities.
Identifying Nutrient Deficiencies
In addition to estimating inadequacy risks, dietary assessments coupled with health markers aid in diagnosing existing micronutrient deficiencies warranting intervention.
Cut-Point Method
This uses measured biomarker levels like ferritin or vitamin B12 blood concentrations coupled with defined deficiency threshold lab cut-points to determine prevalence below adequate status values.
For example, serum ferritin below 15 ng/mL indicates iron deficiency. Comparing population intake data to deficiency likelihoods based on biomarker distributions helps establish dietary risk thresholds.
Probability Method
By combining DRI reference standards with variability estimates of requirements and usual intakes, this method generates probability statements of nutrient inadequacy risk for groups.
Those with habitual intakes below the EAR are likely deficient since their regular intake doesn’t meet the needs of 50% of people. Estimating the proportion below EARs determines possible deficiency prevalence.
In summary, carefully collected dietary intake data compared to reference standards like DRIs, using adequacy evaluation techniques, provides valuable insights into population nutritional status.
Future Directions and Applications
While the current DRIs provide extensive guidance on intake adequacy for essential nutrients, advancing nutrition science is enabling further evolution of dietary reference standards globally to incorporate emerging evidence on requirements for optimal health, additional bioactive compounds, and individualization.
Enhancing International Standardization
International coordination on aligning dietary recommendations globally is increasing to better inform global food trade, policies, and programs with consistent science-based standards.
Groups like the International Network of Food and Obesity/NCDs Research, Monitoring and Action Support (INFORMAS) aim to develop globally applicable food composition profiling models for evaluating products and diets. Common standards would facilitate international efforts to promote healthy eating and address malnutrition.
Expanding DRIs to More Bioactive Compounds
Beyond essential vitamins and minerals, research continues building the evidence base around beneficial bioactives like polyphenols, carotenoids, omega-3s, and prebiotics.
Emerging relationships between some non-nutrients and disease risk reduction may warrant future inclusion in dietary guidance. For instance, polyphenol-rich diets appear cardioprotective. Intake benchmarks for such compounds could incentivize intake via food-based guidance.
Individualization and Precision
Nutrition science continues progressing towards more individualized dietary recommendations based on genetic makeup, microbiome profiles, and biochemical markers.
Precision Nutrition Approaches
This approach utilizes techniques like nutrigenomics to study varied responses to nutrients and foods based on gene variants, along with measuring panels of blood biomarkers, to optimize advice tailored to an individual’s phenotype and genotype.
For example, those with APOE4 gene allele may benefit from lower dietary cholesterol. Direct feedback via biomarkers like blood glucose, vitamin D and homocysteine can help personalize needs.

Nutrigenomics and Personalization
Examining interactions between genes and nutrients is forging new understandings around individual differences in nutrient requirements and metabolism. Nutrient needs are unlikely to fall into single standard recommendations in future guidance.
Specific gene-nutrient relationships may be incorporated into dietary guidelines, like emphasizing adequate choline intake for pregnancy when an individual possesses PEMT gene variants that reduce endogenous choline synthesis.
In summary, advancing nutrition science and technology shows promise for progressing dietary recommendations towards more harmonized, comprehensive and personalized guidance to optimize global public health.
The Future of Optimizing Health Through Evolving Dietary Reference Intakes
Dietary Reference Intakes (DRIs) must keep evolving. This is crucial as nutrition science advances. New evidence constantly emerges on health, biomarkers, and optimal intake ranges across diverse populations.
Ongoing DRI updates should integrate guidance tailored to genetics. They should also align international harmonization of reference values. These steps will ensure DRIs remain the most authoritative benchmark. DRIs assess nutritional adequacy over each phase of life.
Equipping health professionals with the latest, most comprehensive DRIs is vital. This allows substantiating DRIs with the most robust research available. In turn, this empowers more accurate evaluation of nutrient gaps or excesses in individuals and groups.
Up-to-date DRIs allow corrective dietary strategies. These can be personalized for demographics, life stages and health conditions.
Current DRIs are essential reference tools. They enable nutrition experts across pharmacy, regulatory affairs and industry to fulfill their purpose. This purpose is translating nutritional science into maximal wellbeing and resilience for global populations.
Sustained re-evaluation of DRIs is crucial. This supports areas like:
- Bioactives development
- Personalized nutrition approaches
- Informed policymaking
Ongoing DRI updates will be vital well into the future. This will help optimize public health and nutrition guidance worldwide.